The MWMO monitors E. coli bacteria content in the section of the Mississippi River that runs through MWMO’s jurisdiction as well as the stormdrain systems that feed into it.
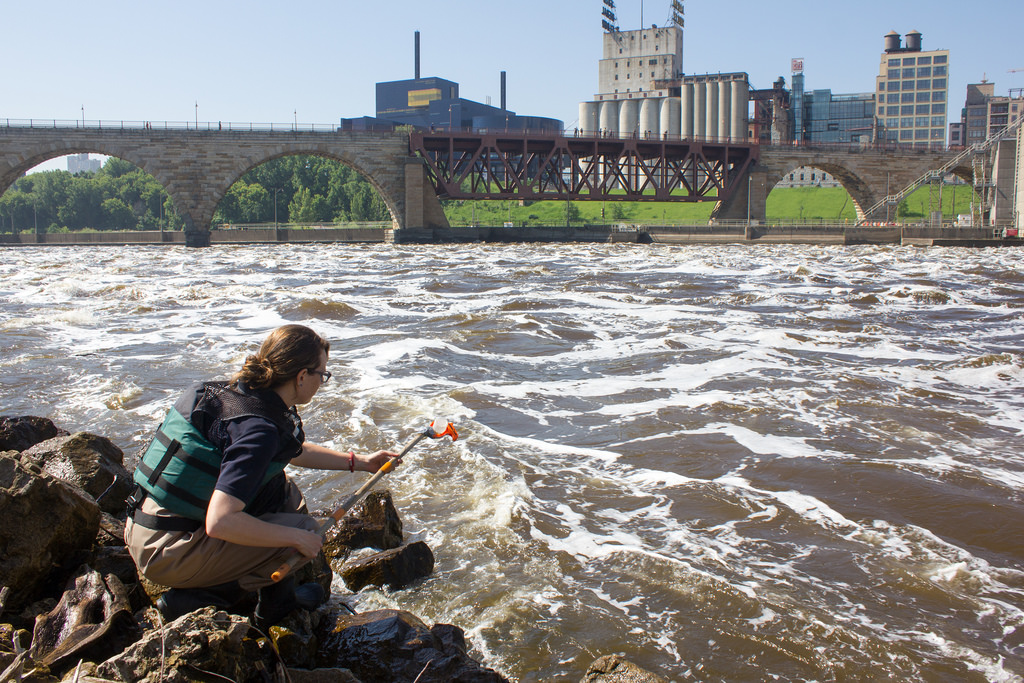
On the river, the MWMO monitors E. coli levels at seven locations. Six of the Mississippi River sites, described in the map below, have been monitored from April through November since 2003. The seventh site (MR853.5E, located at the University of Minnesota’s St. Anthony Falls Hydraulic Laboratory between Upper and Lower Saint Anthony Falls) was added in 2010 to provide data for development of MPCA’s Upper Mississippi River Bacteria Total Max Daily Load (TMDL) project. The monitoring sites are identified by the river mile upstream from the confluence of the Mississippi and Ohio Rivers in Cairo, Illinois, and from the nearest riverbank to the sample collection point. The “E” refers to the eastern river bank and “W” refers to the western river bank. The site with the highest river mile is the farthest upstream.
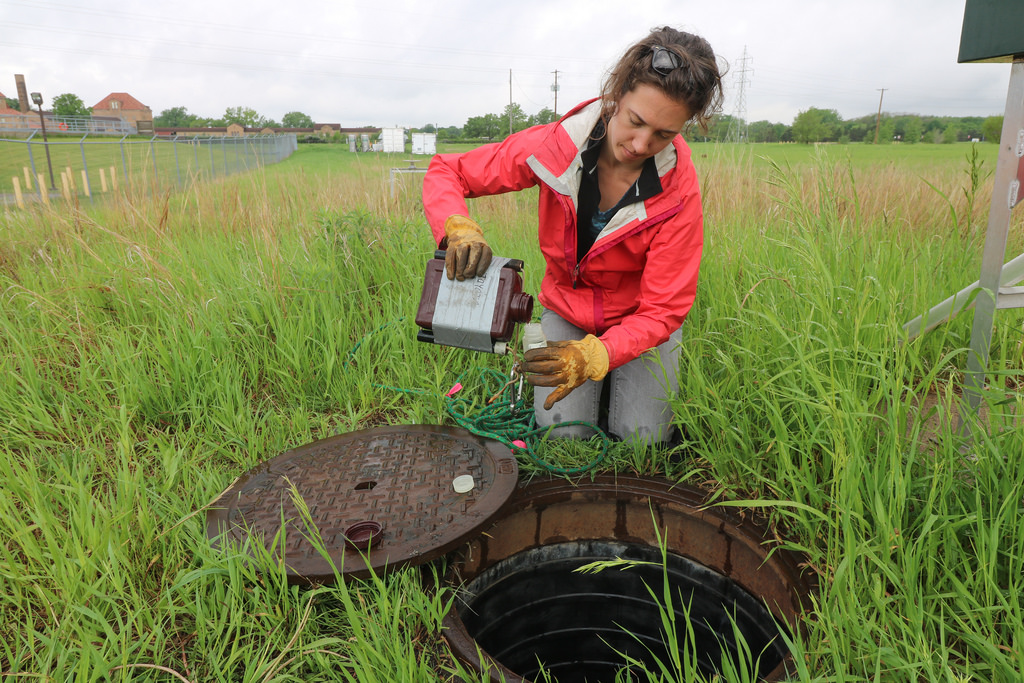
The MWMO monitors five stormwater outfall locations for E. coli, and these sites are sampled concurrently with the river sites.
Methodology
Sample Collection, Handling, and Preservation
Grab samples are collected from seven locations in the Mississippi River (described below) and five stormwater locations twice per month between April and November. Samples collected at the Mississippi River sites occur away from shore, in approximately three feet of water, in positive flow (no back eddies or stagnant water) and upstream of the monitoring specialist to prevent contamination by the disturbed river bottom.
At the stormwater monitoring locations, automated samplers are used to collect grab samples. In some situations, the sample can be collected directly from the flow of water using the lab-sterilized sample bottle, or a low-flow sampler bottle to grab a sample from the storm tunnel. A grab sample is collected only after rinsing the sampling equipment three times. Samples are labeled, stored on ice in a cooler and delivered to the laboratory by the monitoring specialist.
Dissolved oxygen, conductivity, salinity, water temperature and pH values for each site are collected during every sampling event using a water quality sonde. Transparency is measured using a 100 cm Secchi tube. These water quality parameters serve as basic indicators of the health of a waterbody, due to their effects on the survival of fish, plant and other aquatic organisms.
Sampling Quality Control
Blank samples of deionized (DI) water are submitted to laboratories at least four times in a year to verify that sample containers are clean and samples are not contaminated during travel. In addition, 10 percent of all samples are collected in duplicate to verify that sampling and laboratory procedures are not introducing error into the data.
Laboratory Analyses
Bacteria samples are analyzed at the Three Rivers Park District Laboratory. The laboratory follows strict protocols for quality assurance and quality control. Information regarding laboratory protocol is available from MWMO staff.
Mississippi River Bacteria Monitoring Results
Portions of the MWMO’s reach of the Mississippi River are listed on the MPCA’s list of impaired waters for fecal coliform pollution. In 2008, the MPCA changed the bacteria water quality standard from fecal coliform to E. coli for bacteria monitoring in Minnesota. The standard for E. coli in the Mississippi River within the MWMO is 126 CFU/100 mL for a monthly geomean of at least five samples. The MPCA E. coli standard also states that E. coli cannot exceed 1,260 CFU/100mL in more than 10 percent of the samples taken in one month.
Prior to 2013, the MWMO collected E. coli samples at river sites at least five times per month to compute a monthly geomean. During this time, data were collected to contribute to the MPCA’s TMDL assessment of the Upper Mississippi River. In 2014, the MPCA released its Upper Mississippi River Bacteria TMDL Study and Protection Plan (PDF). This document designated the stretch of the Mississippi River within the MWMO as a Protection Reach and deferred it for a TMDL study. This means that based on the data and the status of contributing tributaries, the stretch will be reassessed in the future to determine whether it will require a TMDL. Although the reach is now under protection mode, the MWMO continues to sample for E. coli at least twice per month during April through November, with the goal of maintaining a baseline of data.
In previous years, the MWMO has targeted sampling equally during baseflow conditions and local rain events to ascertain the impact of precipitation on river bacteria levels. Beginning in 2015, monitoring staff began sampling consistently on every second and fourth Thursday of the month, regardless of precipitation conditions. In samples that happen to be taken during rain events, E. coli concentrations are typically an order of magnitude higher than baseflow values, but instances of high E. coli concentrations have also been observed during baseflow conditions, particularly in the fall. Some potential causes of high baseflow E. coli values include water fowl congregating near the sampling site or an illicit discharge of some kind. To lower the risk of exposure to high bacteria levels in the river, it is advisable to avoid swimming during rain and for 72 hours after a rain event.
Additional factors should be considered when evaluating E.coli results. First, results are based on an average of two samples per month. Different results may have been observed if more samples had been collected. Second, two unique features of the MWMO’s watershed are Upper and Lower Saint Anthony Falls. The Mississippi River water mixes as it flows over the falls, likely affecting water quality.
As these results are highly dependent on precipitation, both in the watershed and upstream, results may differ drastically from year to year. MWMO does not support interpretation or assumptions based solely on one year of data. MWMO will continue to collect data on the Mississippi River to provide information for development of TMDLs in the watershed. Mississippi River E. coli data are submitted to the MPCA’s EQUIS database and can be accessed there. Further discussion of results can be found in the MWMO’s Annual Monitoring Reports.
River Bacteria Monitoring Data
2017 Mississippi River Bacteria Sampling Data (PDF, 13 pages, 1 MB)
2018 Mississippi River Bacteria Sampling Data (PDF, 12 pages, 1 MB)
2019 Mississippi River Bacteria Sampling Data (PDF, 13 pages, 1 MB)
2020 Mississippi River Bacteria Sampling Data (PDF, 14 pages, 0.5 MB)
2021 Mississippi River Bacteria Sampling Data (PDF, 14 pages, 0.7 MB)
2022 Mississippi River Bacteria Sampling Data (PDF, 14 pages, 0.7 MB)
2023 Mississippi River Bacteria Sampling Data (PDF, 13 pages, 4.7 MB)
For bacteria data from 2024 on, please reach out to monitoring@mwmo.org.
For previous years’ data, see our Annual Monitoring Reports.
Stormwater Bacteria Monitoring Results
Five of MWMO’s stormwater outfalls are monitored for E. coli year-round. Sampling at stormwater outfalls occurs concurrently with river bacteria sampling between April and November. In the winter months between December and March, MWMO collects dry weather bacteria samples from those same outfalls once per month. Stormwater outfall site descriptions can be found in the Stormwater Monitoring section of this website. Sampling methods are detailed in the prior Methodology portion of this section. Samples collected during, or immediately following, rain events have E. coli concentrations that are typically an order of magnitude higher than baseflow values, however instances of elevated E. coli concentrations are observed during baseflow conditions. The most likely causes of high baseflow E. coli values are illicit discharges into the stormwater pipes or wildlife presence within the pipes. MWMO notifies the applicable member city when there are high baseflow E. coli values of concern. As with the river data, stormwater E. coli monitoring data for a given year can be found within the MWMO annual monitoring reports and individual station sections on this website and the data are submitted to the MPCA’s EQUIS database.
For the most part, both baseflow and stormflow bacteria concentrations are higher at the stormwater sites than at the river sites. This is to be expected with the difference in volumes between stormwater discharges and the Mississippi River itself; however, data suggest that stormwater may be a large contributor of bacteria to the Mississippi River, particularly during storm events.