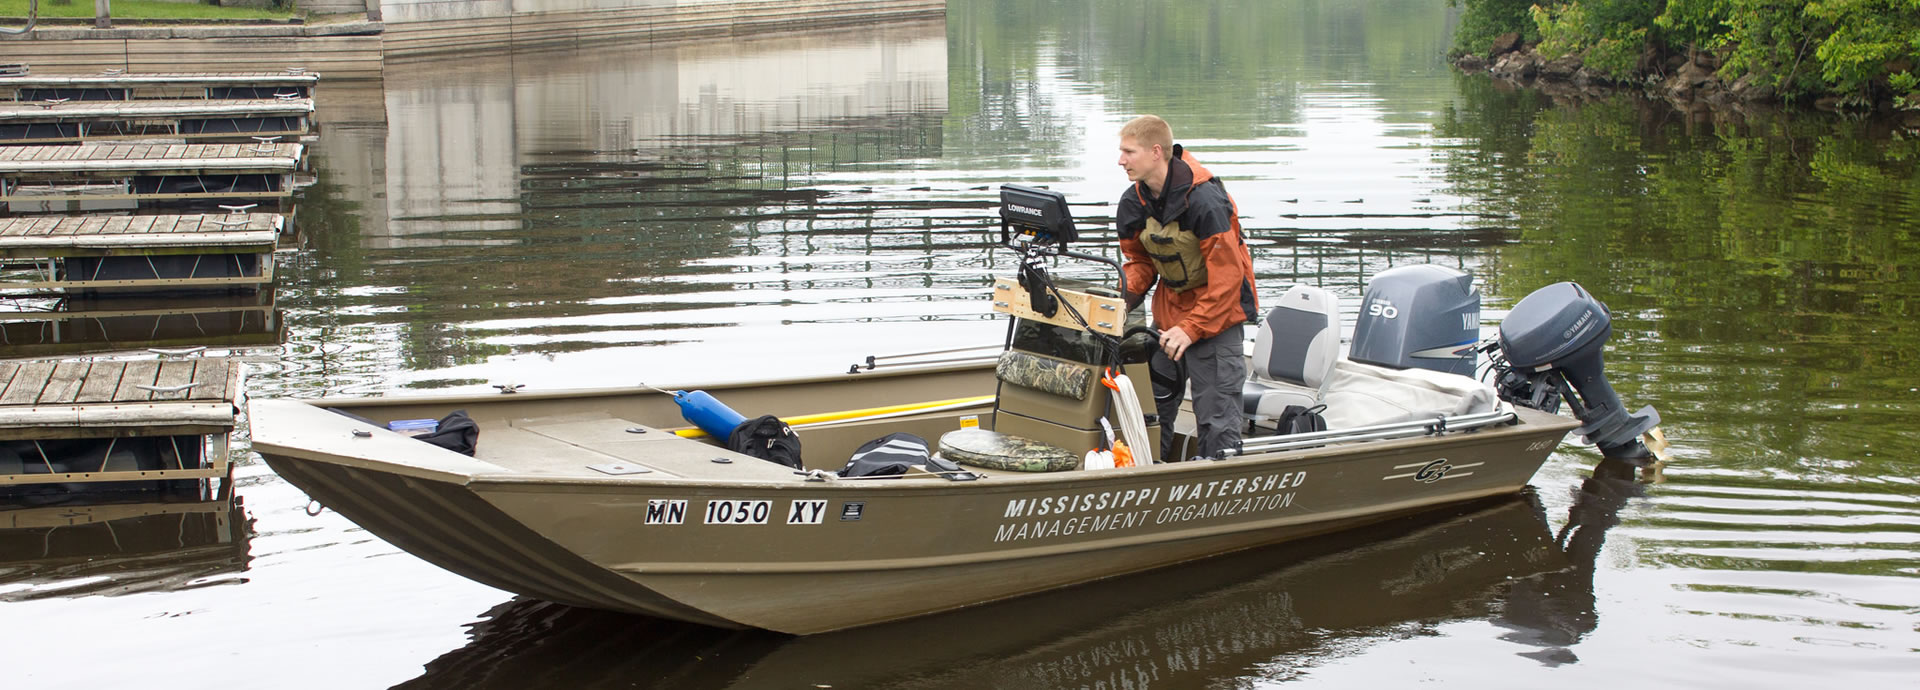
MWMO staff began collecting water quality samples from the Mississippi River in 2014. The purpose of monitoring the water quality of the Mississippi River is to establish baseline water quality data that can be used for the management of the river. Water quality measurements and samples are collected 1-2 times per month at seven sites. Monitoring sites on the Mississippi River have been selected to represent three distinct reaches of the river. Each site is located within, at the beginning of, or at the end of a river reach. Samples are collected from the middle of the river, 3 feet below the surface as conditions allow. Sampling occurs progressively from the most downstream site to the most upstream site.
Data on Mississippi River water levels are also collected regularly from April to November. Staff gauges are installed at six locations along the river and are read every other week, on average.
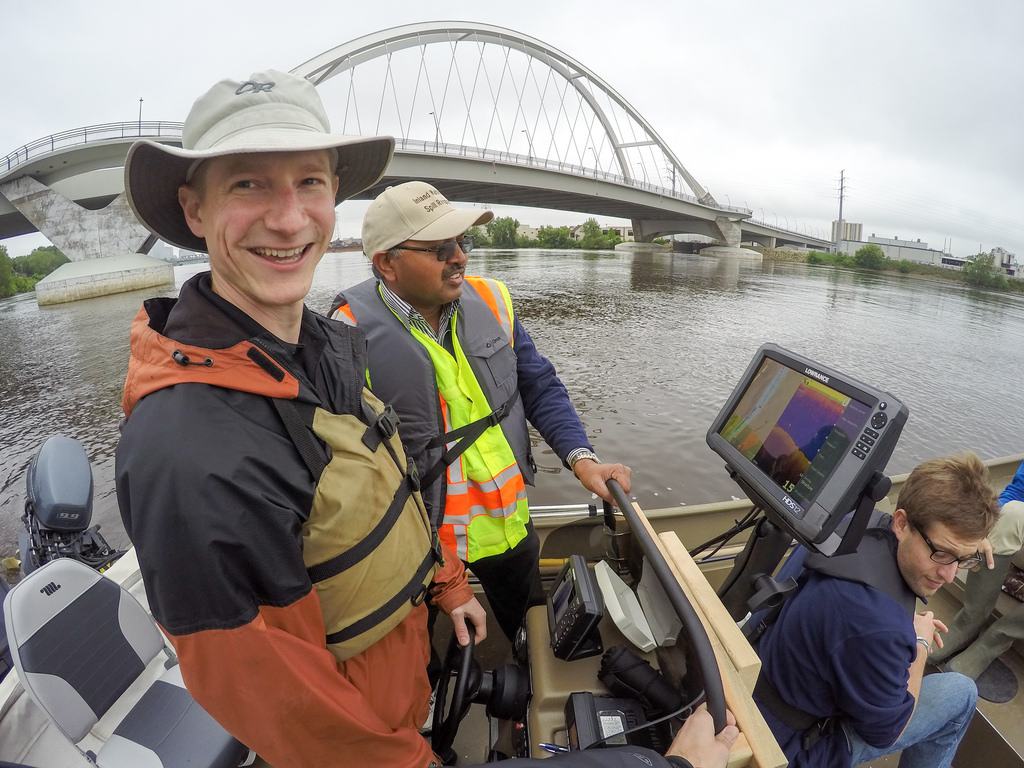
The MWMO also conducts bathymetric mapping to provide baseline data on Mississippi River bed morphology. The mapping project produces 1 foot depth contours. Through this project, we are able to map rock piles, deep holes, navigation channels, dunes, pilings and other structures and observe how the river bottom changes through time. This is of particular interest with respect to the recent closure of the Upper St. Anthony Falls Lock and the concurrent lack of dredging upstream of the lock.
Mississippi River Water Quality Monitoring
Methodology
Sample Collection, Handling, and Preservation
Samples are collected by boat in the middle of the river, three feet below the surface, using a Van Dorn sampler. The sampler is rinsed with river water and then is filled three times to collect enough water to fill a laboratory-cleansed (non-sterile) plastic bottle. Samples are stored in a cooler for transport to the laboratory. Certain water quality measurements are collected from the river by lowering a multimeter sonde three feet below the water surface. When boating to the sample site is not possible, samples are collected by lowering the Van Dorn sampler from bridges or by filling a laboratory-cleansed (non-sterile) plastic bottle from riverbanks.
Sampling Quality Control
Blank samples of DI water are submitted to laboratories regularly to verify that sample containers are clean and samples are not contaminated during travel. Additionally, 10 percent of all samples are collected in duplicate to verify that sampling and laboratory procedures do not introduce any error.
Laboratory Analyses
All samples are analyzed at the Metropolitan Council Environmental Services (MCES) Laboratory. MCES follows strict protocols for quality assurance and quality control. Information regarding laboratory protocol is available from MWMO staff. Refer to Table A.1 in Appendix A of the annual monitoring reports for a list of sample parameters, the laboratories used for analysis, the analysis methods, and information regarding certification.
Site Descriptions
River water quality samples are taken at eight locations between the Ford Dam (Lock and Dam No.1) and the 694 bridge. All samples are collected from the middle of the channel when possible. During winter months, some of the sampling locations are adjusted based upon access to open river water.
River Water Quality Monitoring Results
Samples are collected for nutrients, sediment, inorganics, organics, and metals analyses. Data are submitted annually to the MPCA’s water quality database (EQuIS) and are also available upon request from MWMO monitoring staff.
2017 River Water Quality Data (PDF, 21 pages, 1.4 MB)
2018 River Water Quality Data (PDF, 18 pages, 0.6 MB)
2019 River Water Quality Data (PDF, 18 pages, 0.6 MB)
2020 River Water Quality Data (PDF, 18 pages, 0.1 MB)
2021 River Water Quality Data (PDF, 18 pages, 0.8 MB)
2022 River Water Quality Data (PDF, 18 pages, 0.8 MB)
2023 River Water Quality Data (PDF, 18 pages, 1.1 MB)
For river water quality data from 2024 on, please reach out to monitoring@mwmo.org.
For previous years’ data, see our Annual Monitoring Reports.
Mississippi River Water Elevation Monitoring
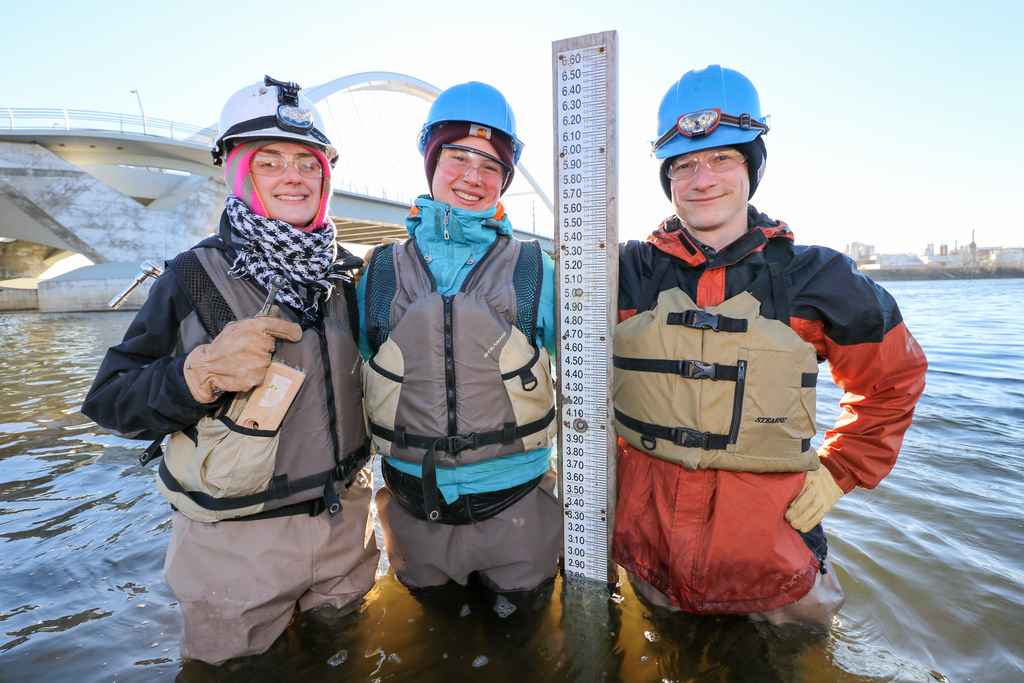
The MWMO has monitored Mississippi River water elevations (commonly referred to as stage) at six bacteria sampling site locations since 2005. Mississippi River water elevations rise and fall in response to precipitation events and snow melt, and are also influenced by the dams at St. Anthony Falls and Lock & Dam No. 1. Since the river pools behind the dams, control activities at the dam cause changes in river elevation, even in the absence of precipitation.
Each year, MWMO staff install and survey the river gauges to a nearby benchmark. Gauges are also surveyed before they are removed for the season to ensure they did not move throughout the year.
River level measurements are recorded at each gauge at least twice per month and are converted to an elevation. The MWMO river elevation data are equivalent to data collected by agencies using the North American Vertical Datum, 1988 (NAVD88).
River Elevation Monitoring Results
Mississippi River Elevation Data (2015-2019) (PDF, 9 pages, 1 MB)
Mississippi River Elevation Data (2020 Update) (PDF, 9 pages, 0.2 MB)
Mississippi River Elevation Data (2021 Update) (PDF, 9 pages, 0.2 MB)
Mississippi River Elevation Data (2022 Update) (PDF, 9 pages, 0.2 MB)
Mississippi River Elevation Data (2023 Update) (PDF, 9 pages, 0.2 MB)
For river elevation data from 2024 on, please reach out to monitoring@mwmo.org.
For previous years’ data, see our Annual Monitoring Reports.
Mississippi River Bathymetry Mapping
The purpose of collecting Mississippi River bathymetric data is to provide baseline data on the Mississippi River. This mapping project records the morphology of the river bed. Rock piles, deep holes, navigation channels, dunes, pilings and other structures are mapped. The mapping produced data that show 1-foot contours, hardness, track, and vegetation.
Launched in 2014, Mississippi River bathymetric mapping is performed in the summer months when navigation is easiest along shore and upstream where the river bottom is typically rocky and shallow. The MWMO maps the entire reach of the Mississippi River within the watershed boundaries: between Lock and Dam No.1 at the Ford Bridge in Minneapolis to just downstream of the Hwy 694 Bridge in Fridley. The MWMO uses a Lowrance HDS-5 Gen2 Fishfinder/Chartplotter (Navico, Inc.) device to collect data along with a Lowrance Point-1 GPS/HDG Antenna (Navico, Inc.) to increase position accuracy. The boat is navigated along a course of parallel tracks covering the area between river banks at a speed of approximately 5 miles per hour to ensure high-quality data. A BioBase (Navico, Inc.) server is used to store the data and merge it to form a single map of the river bottom.
Changes in river morphology will be tracked over multiple years and maps will be created to display the changing river bottom.
For bathymetric mapping data, please reach out to monitoring@mwmo.org.