The MWMO monitors water quantity and quality at several stormwater outfalls into the Mississippi River, as well as some upstream stormwater pipe sites. Monitoring stormwater is necessary to help us understand the effect that our highly urbanized watershed has on the amount and quality of the water that runs off the landscape and into the Mississippi River.
The MWMO watershed can be broken up into pipesheds, areas of the urban landscape that drain to one stormwater outfall. Land use in each pipeshed affects water quality and the amount of impervious surface and potential pollution differs between industrial, residential, and commercial land uses. The locations that the MWMO monitors were chosen, in part, because they are the most extensive pipesheds within the watershed, they are accessible for equipment installation. Some sites were selected to provide data for specific research or modeling projects.
Five of the MWMO’s monitored locations are long-term sites and collect continuous water level and velocity measurements as well as water quality samples during both storm and baseflow (dry weather) conditions. Stormwater monitoring equipment has been installed on a shorter-term basis at other stormwater pipe locations.
Stormwater Monitoring Sites
11CHF (Columbia Heights, Hilltop, and Fridley)
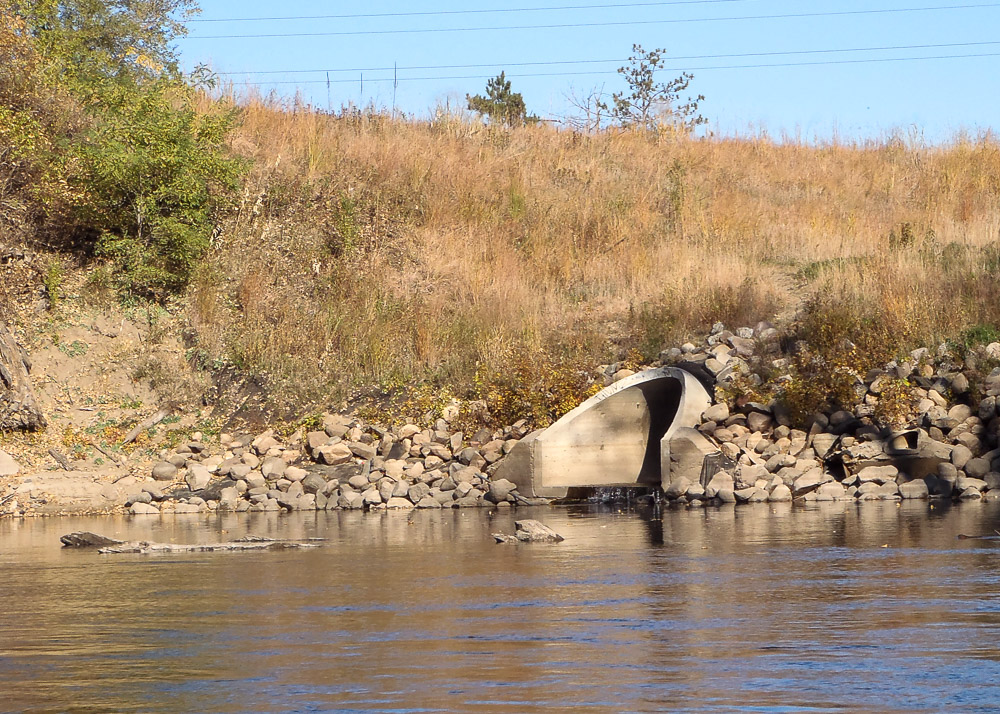
The 11CHF stormwater monitoring site was installed in 2014 and is located about 1,900 feet upstream of the pipeshed’s outfall and is one of the MWMO’s northernmost monitoring sites. The outfall is located on the east bank of the Mississippi River at river mile 859, about 50 feet upstream from the Minneapolis Public Works Fridley Water Treatment Plant’s property in the Anoka County Riverfront Regional Park. The outfall is a seven-foot diameter, round concrete pipe. This stormwater drainage system drains water from approximately 1,310 acres of parts of the cities of Columbia Heights, Hilltop, and Fridley (see map below). The 11CHF pipeshed includes mainly industrial and residential land uses and has continuous baseflow.
The monitoring site is outfitted with an area-velocity sensor, conductivity sensor, and an automated water sampler. Baseflow samples are collected twice per month and rain event samples are collected up to three times per month. Snowmelt events are also captured when possible during the winter and spring months.
2017 11CHF Stormwater Quantity Chart (PDF, 1 page, 0.1 MB)
2018 11CHF Stormwater Quantity Chart (PDF, 1 page, 0.1 MB)
2019 11CHF Stormwater Quantity Chart (PDF, 1 page, 0.1 MB)
2020 11CHF Stormwater Quantity Chart (PDF, 1 page, 0.1 MB)
2021 11CHF Stormwater Quantity Chart (PDF, 1 page, 0.1 MB)
2022 11CHF Stormwater Quantity Chart (PDF, 1 page, 0.1 MB)
2023 11CHF Stormwater Quantity Chart (PDF, 1 page, 0.2 MB)
For data from 2024 on, please reach out to monitoring@mwmo.org.
2016 11CHF Stormwater Water Quality Data Table (PDF, 9 pages, 0.5 MB)
2017 11CHF Stormwater Water Quality Data Table (PDF, 6 pages, 0.3 MB)
2018 11CHF Stormwater Water Quality Data Table (PDF, 6 pages, 0.2 MB)
2019 11CHF Stormwater Water Quality Data Table (PDF, 6 pages, 0.3 MB)
2020 11CHF Stormwater Water Quality Data Table (PDF, 3 pages, 0.1 MB)
2021 11CHF Stormwater Water Quality Data Table (PDF, 6 pages, 0.3 MB)
2022 11CHF Stormwater Water Quality Data Table (PDF, 3 pages, 0.1 MB)
2023 11CHF Stormwater Water Quality Data Table (PDF, 3 pages, 0.4 MB)
For data from 2024 on, please reach out to monitoring@mwmo.org.
1NE (Northeast Minneapolis)
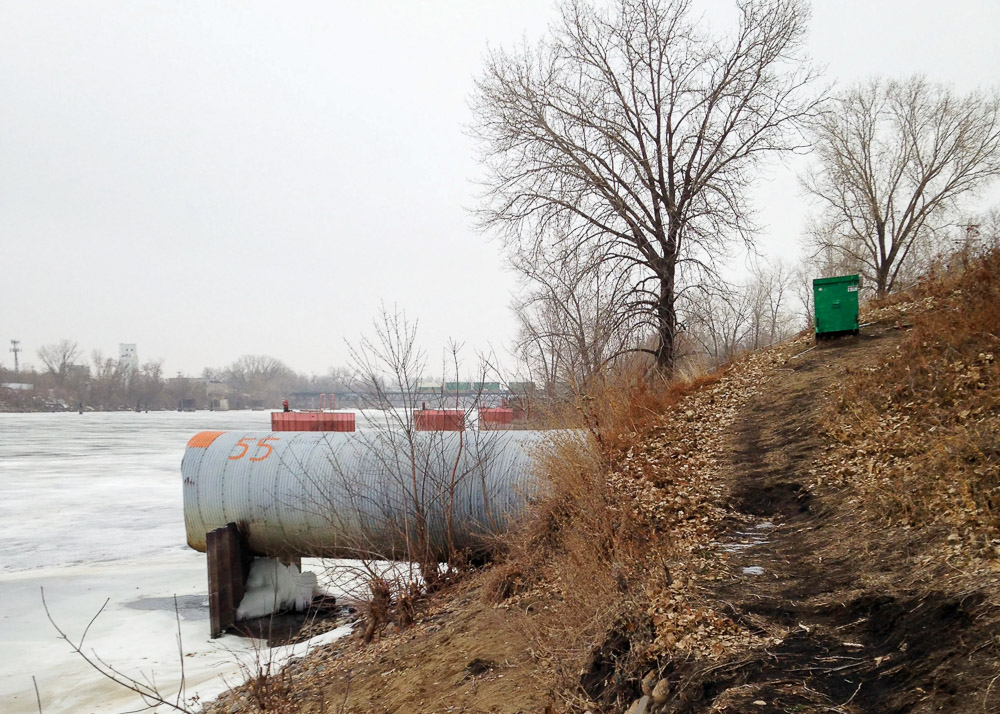
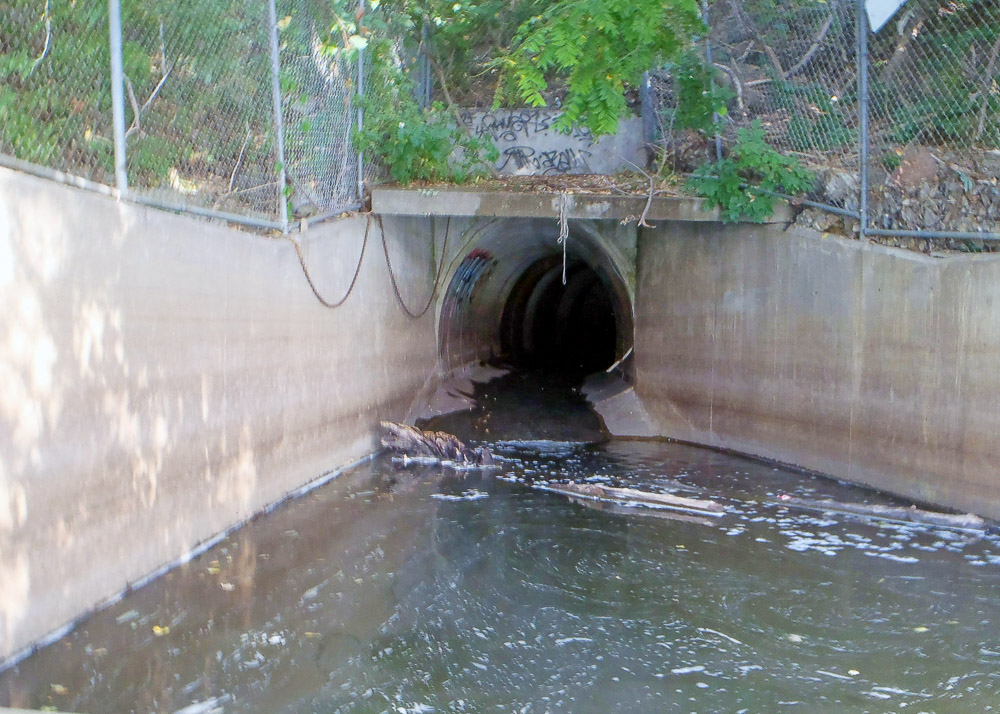
Stormwater monitoring equipment was installed at the 1NE pipeshed outfall in 2006. The outfall is located on the east bank of the Mississippi River on the Xcel Riverside Power Plant property at river mile 857.2 and is an eight-foot diameter, corrugated iron pipe. The stormwater drainage system drains water from approximately 2,240 acres of the Northeast Minneapolis neighborhood as well as portions of Columbia Heights and Fridley. The pipeshed includes mainly residential and industrial land uses and has continuous baseflow.
A second monitoring station called 1.2NE, located a couple hundred feet up the pipe, was installed in 2017. The part of the tunnel where 1.2NE is installed has a less extreme slope and is not corrugated pipe like the original location. Both sites have area-velocity sensors and automated water samplers. Baseflow water quality samples are collected twice per month and rain event samples are collected up to three times per month at the outfall.
2017 1NE Stormwater Quantity Chart (PDF, 1 page, 0.1 MB)
2018 1NE Stormwater Quantity Chart (PDF, 1 page, 0.1 MB)
2019 1NE Stormwater Quantity Chart (PDF, 1 page, 0.1 MB)
2020 1NE Stormwater Quantity Chart (PDF, 1 page, 0.1 MB)
2021 1NE Stormwater Quantity Chart (PDF, 1 page, 0.1 MB)
2022 1NE Stormwater Quantity Chart (PDF, 1 page, 0.1 MB)
2023 1NE Stormwater Quantity Chart (PDF, 1 page, 0.2 MB)
For data from 2024 on, please reach out to monitoring@mwmo.org.
2016 1NE Stormwater Water Quality Data Table (PDF, 6 pages, 0.3 MB)
2017 1NE Stormwater Water Quality Data Table (PDF, 6 pages, 0.2 MB)
2018 1NE Stormwater Water Quality Data Table (PDF, 6 pages, 0.2 MB)
2019 1NE Stormwater Water Quality Data Table (PDF, 3 pages, 0.2 MB)
2020 1NE Stormwater Water Quality Data Table (PDF, 3 pages, 0.1 MB)
2021 1NE Stormwater Water Quality Data Table (PDF, 6 pages, 0.3 MB)
2022 1NE Stormwater Water Quality Data Table (PDF, 6 pages, 0.3 MB)
2023 1NE Stormwater Water Quality Data Table (PDF, 3 pages, 0.4 MB)
For data from 2024 on, please reach out to monitoring@mwmo.org.
2NNBC (Old Bassett’s Creek Tunnel Outlet, Near North Minneapolis)
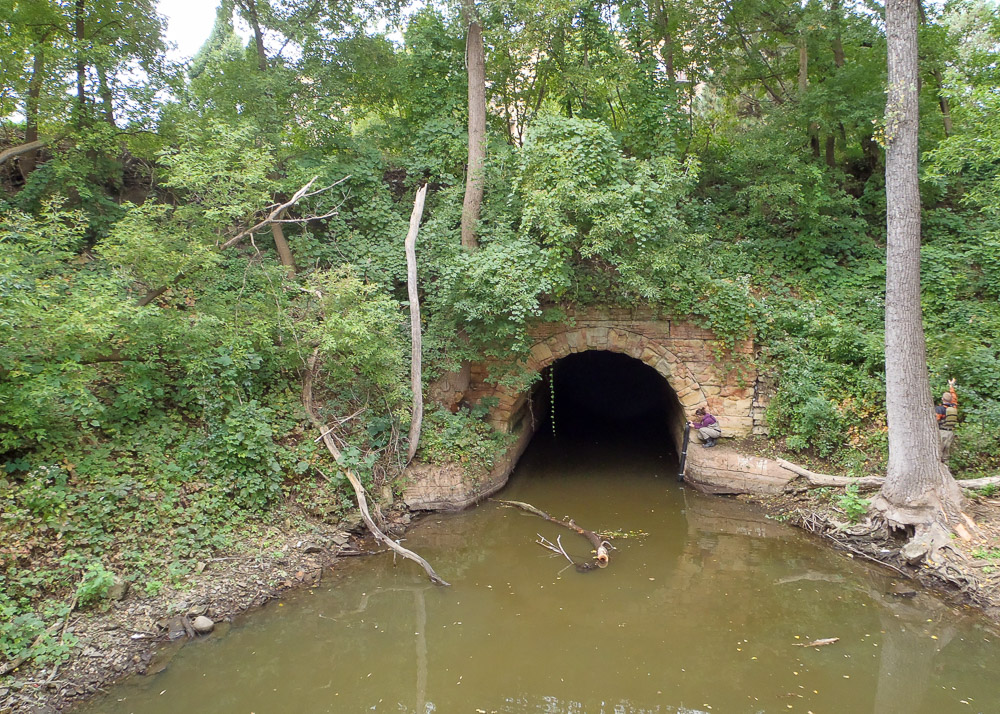
The 2NNBC outfall drains water from 1,067 acres of the Near North Minneapolis neighborhood and Bassett’s Creek overflow. It enters the river in a park in the North Loop neighborhood of Minneapolis on the west bank of the Mississippi River at river mile 854.8. Land use in the pipeshed is primarily residential and commercial. The semi-elliptical outfall is approximately 11 feet high and 15 feet wide. Bassett’s Creek was buried and routed through this tunnel in 1890. In 1992, the creek was rerouted through a new tunnel that enters the Mississippi River below the surface water level, just downstream from Upper Saint Anthony Falls. Water from Bassett’s Creek only flows through the original outfall during overflow periods.
The MWMO monitors the water level at the mouth of the tunnel, which is almost always Mississippi River water. Water quality samples have been collected in the past during baseflow and rain events, but has not been collected in recent years due to river water extending far into the tunnel.
10SA (St. Anthony Village)
The 10SA monitoring site was established in 2007. 10SA differs from the other MWMO stormwater monitoring sites as it is located at the jurisdictional boundary between St. Anthony Village and Minneapolis, rather than at an outfall to the Mississippi River. The MWMO chose to monitor this location to investigate the quantity and quality of stormwater from the southern portion of St. Anthony Village (602 acres) as it enters Minneapolis. The concrete stormwater pipe is four and a half feet in diameter and is accessed at a manhole within an open green space in a residential neighborhood next to New Brighton Boulevard (Highway 88). The tunnel eventually drains into the Mississippi River several miles away on the east bank at river mile 853.2. Land uses are mainly residential, commercial, and industrial.
There is typically continuous baseflow in this stormwater drainage system although the amount is much less in winter. Water quality samples are collected using an automated sampler equipped with an area-velocity sensor to measure flow. Continuous conductivity data is also collected at this site. Baseflow samples are collected twice per month and rain event samples are collected up to three times per month. Melt event samples are collected when possible during the winter and spring. In 2016, the St. Anthony Regional Stormwater Treatment and Research System was installed just upstream of 10SA (see BMP monitoring section).
Equipment issues precluded reliable flow data from being collected at 10SA in 2023.
2017 10SA Stormwater Quantity Chart (PDF, 1 page, 0.1 MB)
2018 10SA Stormwater Quantity Chart (PDF, 1 page, 0.1 MB)
2019 10SA Stormwater Quantity Chart (PDF, 1 page, 0.1 MB)
2020 10SA Stormwater Quantity Chart (PDF, 1 page, 0.1 MB)
2021 10SA Stormwater Quantity Chart (PDF, 1 page, 0.1 MB)
2022 10SA Stormwater Quantity Chart (PDF, 1 page, 0.1 MB)
For data from 2024 on, please reach out to monitoring@mwmo.org.
2016 10SA Stormwater Water Quality Data Table (PDF, 6 pages, 0.4 MB)
2017 10SA Stormwater Water Quality Data Table (PDF, 6 pages, 0.3 MB)
2018 10SA Stormwater Water Quality Data Table (PDF, 9 pages, 0.2 MB)
2019 10SA Stormwater Water Quality Data Table (PDF, 6 pages, 0.3 MB)
2020 10SA Stormwater Water Quality Data Table (PDF, 6 pages, 0.1 MB)
2021 10SA Stormwater Water Quality Data Table (PDF, 6 pages, 0.2 MB)
2022 10SA Stormwater Water Quality Data Table (PDF, 3 pages, 0.1 MB)
2023 10SA Stormwater Water Quality Data Table (PDF, 3 pages, 0.4 MB)
For data from 2024 on, please reach out to monitoring@mwmo.org.
4PP (Phillips and Powderhorn Neighborhoods, Minneapolis)
Established in 2008, this stormwater outfall monitoring site is located below Lower Saint Anthony Falls Lock and Dam on the west bank of the Mississippi River at river mile 853.2. The semi-elliptical tunnel is 14 feet high and 14 feet wide. The system drains stormwater from approximately 2,780 acres of the Phillips and Powderhorn Neighborhoods and the southern portion of the Central neighborhood in Minneapolis, as well as water from the I-35W interstate highway. Land use is primarily residential, commercial, and heavy industry.
There is continuous baseflow in this stormwater drainage system. The 4PP monitoring site is outfitted with an area-velocity sensor to measure stormwater level and flow. Baseflow samples are collected twice per month when possible. Due to construction activity in the tunnel, no data were collected between January 2016 and August 2019. An area-velocity sensor was reinstalled in September 2019, but equipment issues precluded reliable flow data from being collected in 2023.
2020 4PP Stormwater Quantity Chart (PDF, 1 page, 0.1 MB)
2021 4PP Stormwater Quantity Chart (PDF, 1 page, 0.1 MB)
2022 4PP Stormwater Quantity Chart (PDF, 1 page, 0.1 MB)
For data from 2023 on, please reach out to monitoring@mwmo.org.
2016 4PP Stormwater Water Quality Data Table (PDF, 3 pages, 0.2 MB)
2017 4PP Stormwater Water Quality Data Table (PDF, 3 pages, 0.2 MB)
2018 4PP Stormwater Water Quality Data Table (PDF, 3 pages, 0.1 MB)
2019 4PP Stormwater Water Quality Data Table (PDF, 3 pages, 0.2 MB)
2020 4PP Stormwater Water Quality Data Table (PDF, 3 pages, 0.1 MB)
2021 4PP Stormwater Water Quality Data Table (PDF, 3 pages, 0.2 MB)
2022 4PP Stormwater Water Quality Data Table (PDF, 3 pages, 0.2 MB)
2023 4PP Stormwater Water Quality Data Table (PDF, 3 pages, 0.4 MB)
For data from 2024 on, please reach out to monitoring@mwmo.org.
6UMN (University of Minnesota, Minneapolis)
The 6UMN outfall site was established in 2006 and is located on the east bank of the Mississippi River at river mile 853, downstream from Saint Anthony Falls, behind the University of Minnesota Main Energy Plant. This semi-elliptical tunnel is eight feet high and eight feet wide with a rounded top and slightly U-shaped base. The outfall drains water from approximately 765 acres of the City of Minneapolis and the University of Minnesota, Minneapolis Campus. Land use is primarily residential and commercial.
There is continuous baseflow in this stormwater drainage system. The monitoring site is outfitted with an automated sampler, area-velocity sensor, and a conductivity sensor. Baseflow water quality samples are collected twice per month and rain event samples are collected three times per month when possible.
2017 6UMN Stormwater Quantity Chart (PDF, 1 page, 0.1 MB)
2018 6UMN Stormwater Quantity Chart (PDF, 1 page, 0.4 MB)
2019 6UMN Stormwater Quantity Chart (PDF, 1 page, 0.1 MB)
2020 6UMN Stormwater Quantity Chart (PDF, 1 page, 0.1 MB)
2021 6UMN Stormwater Quantity Chart (PDF, 1 page, 0.1 MB)
2022 6UMN Stormwater Quantity Chart (PDF, 1 page, 0.1 MB)
2023 6UMN Stormwater Quantity Chart (PDF, 1 page, 0.1 MB)
For data from 2024 on, please reach out to monitoring@mwmo.org.
2016 6UMN Stormwater Water Quality Data Table (PDF, 6 pages, 0.4 MB)
2017 6UMN Stormwater Water Quality Data Table (PDF, 3 pages, 0.2 MB)
2018 6UMN Stormwater Water Quality Data Table (PDF, 3 pages, 0.1 MB)
2019 6UMN Stormwater Water Quality Data Table (PDF, 3 pages, 0.2 MB)
2020 6UMN Stormwater Water Quality Data Table (PDF, 3 pages, 0.1 MB)
2021 6UMN Stormwater Water Quality Data Table (PDF, 3 pages, 0.2 MB)
2022 6UMN Stormwater Water Quality Data Table (PDF, 3 pages, 0.2 MB)
2023 6UMN Stormwater Water Quality Data Table (PDF, 3 pages, 0.5 MB)
For data from 2024 on, please reach out to monitoring@mwmo.org.
7LSTU (Bridal Veil Tunnel, Minneapolis)
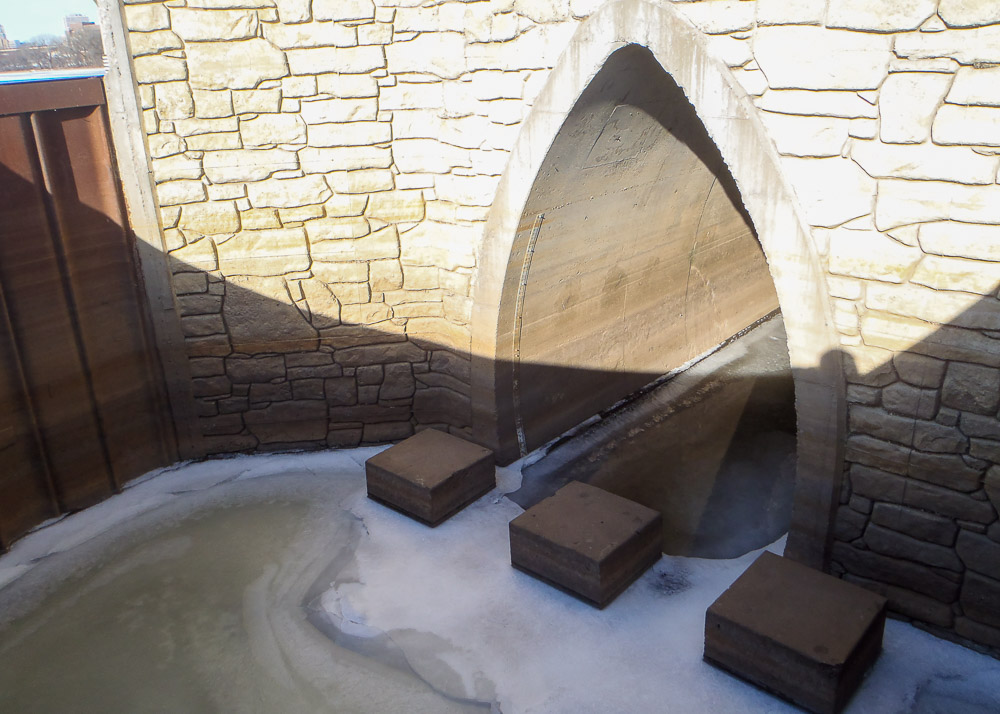
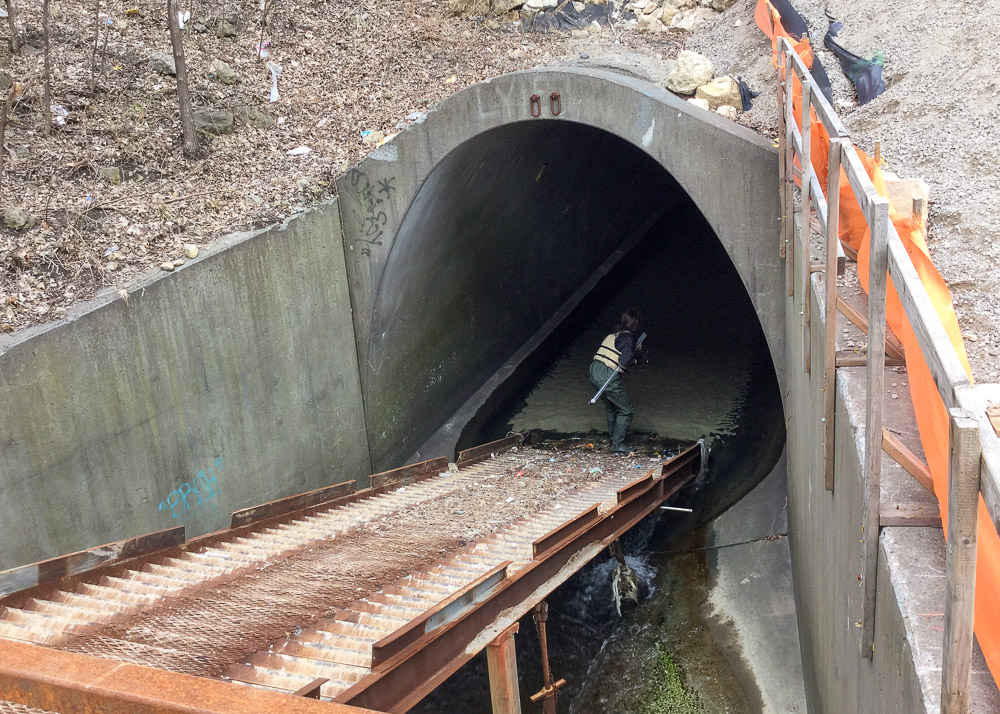
7LSTU is the farthest downstream stormwater outfall monitored by the MWMO. The monitoring site was established in 2008 and is located on the east bank of the Mississippi River at river mile 851.6 near the Franklin Avenue Bridge. The cathedral-shaped tunnel is a little over 10 feet high and a little less than 7 feet wide at its base. At the mouth of the outfall there are five square concrete pillars that slow water flow, and an iron stilling basin to capture floatable debris. The outfall drains water from approximately 600 acres of the City of Minneapolis and the University of Minnesota’s Minneapolis Campus. Land uses within the pipeshed are a mix of residential, commercial and industrial.
The 7LSTU monitoring site was previously equipped with an automated sampler and area-velocity sensor; however, river water is almost constantly present in the tunnel near the outfall, affecting discharge values. In the fall of 2016, an area-velocity sensor was installed farther up the tunnel in order to obtain more consistent discharge data. Baseflow water quality samples are collected during regular equipment maintenance activities.
2019 7LSTU Stormwater Quantity Chart (PDF, 1 page, 0.1 MB)
2020 7LSTU Stormwater Quantity Chart (PDF, 1 page, 0.1 MB)
2021 7LSTU Stormwater Quantity Chart (PDF, 1 page, 0.1 MB)
2022 7LSTU Stormwater Quantity Chart (PDF, 1 page, 0.1 MB)
2023 7LSTU Stormwater Quantity Chart (PDF, 1 page, 0.2 MB)
For data from 2024 on, please reach out to monitoring@mwmo.org.
2020 7LSTU Stormwater Water Quality Data Table (PDF, 3 pages, 0.1 MB)
2021 7LSTU Stormwater Water Quality Data Table (PDF, 3 pages, 0.1 MB)
2022 7LSTU Stormwater Water Quality Data Table (PDF, 3 pages, 0.1 MB)
2023 7LSTU Stormwater Water Quality Data Table (PDF, 3 pages, 0.4 MB)
For data from 2024 on, please reach out to monitoring@mwmo.org.
Stormwater Water Quality Monitoring Results
The Minnesota Pollution Control Agency (MPCA) does not have water quality criteria for stormwater drainage systems; therefore, data are not compared with standards. The MWMO monitors stormwater to characterize surface runoff in the watershed and determine land contributions to water quality in the Mississippi River. Samples are collected for bacteria, nutrients, sediment, inorganics, organics and metals analyses.
The MWMO does not draw conclusions or make assumptions based on this data until several years of accurate flow-weighted composite data are available.The MWMO has begun calculating annual pollutant loads at stormwater monitoring sites where several years of data do exist. Water quality data are submitted to the MPCA’s water quality database (EQuIS) and are available upon request from MWMO monitoring staff. Stormwater bacteria data are discussed in the Bacteria Monitoring section of this website.
2016 Stormwater Monitoring Data (PDF, 30 pages, 0.5 MB)
2017 Stormwater Monitoring Data (PDF, 24 pages, 1.2 MB)
2018 Stormwater Monitoring Data (PDF, 27 pages, 1.4 MB)
2019 Stormwater Monitoring Data (PDF, 21 pages, 1.1 MB)
Data after 2019 can be found under individual stormwater site sections above or by reaching out to monitoring@mwmo.org.
For previous years’ data, see our Annual Monitoring Reports or reach out to monitoring@mwmo.org.
Methodology
Water Level and Velocity Monitoring
Water level in a stormwater pipe is very different from water level in the Mississippi River. Stormwater pipes respond quickly to rainfall, so water levels may rise many feet within a few minutes, depending on the size and intensity of the storm event. Some stormwater pipes only contain water during precipitation events, while others have baseflow throughout the year. Most stormwater pipes monitored by the MWMO have varying levels of baseflow year round. Baseflow in stormwater pipes is typically from groundwater or permitted discharges into the stormwater system.
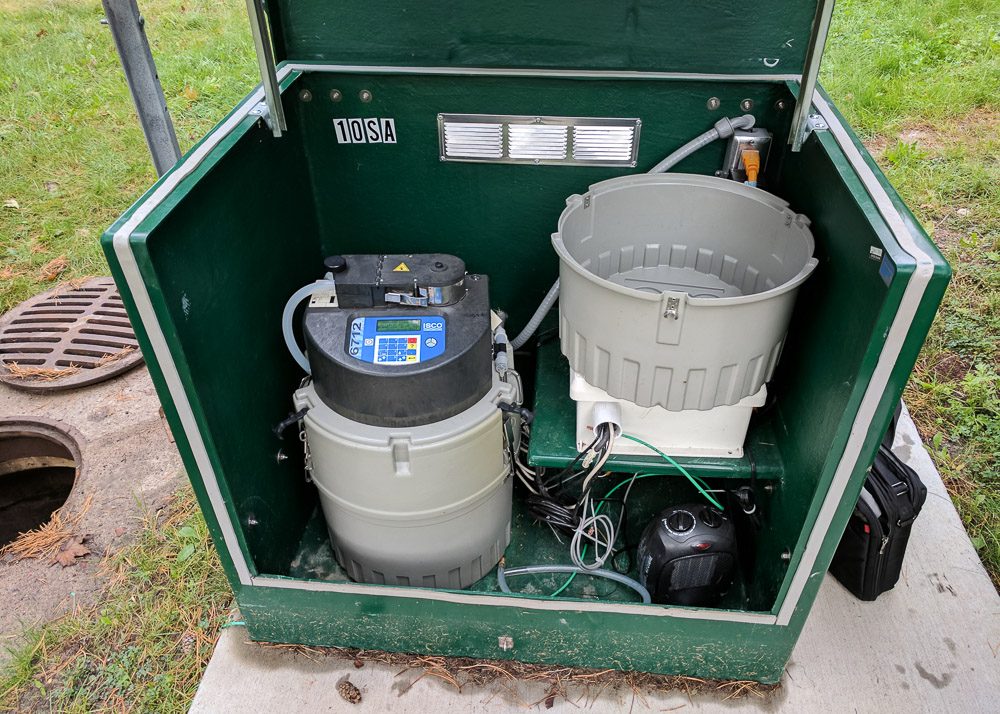
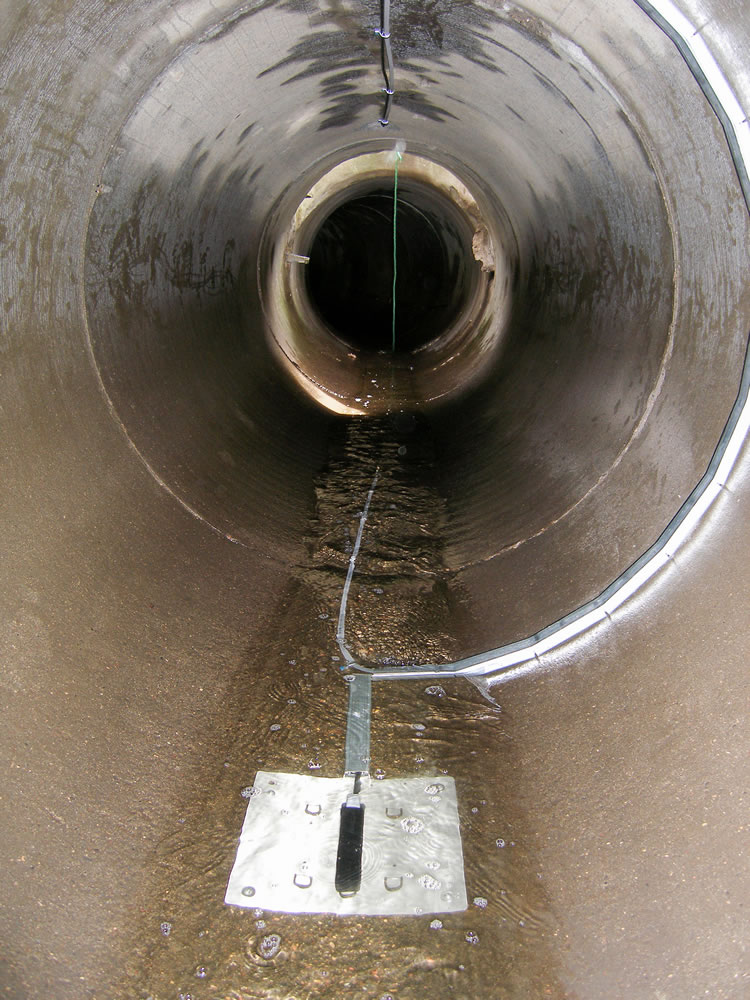
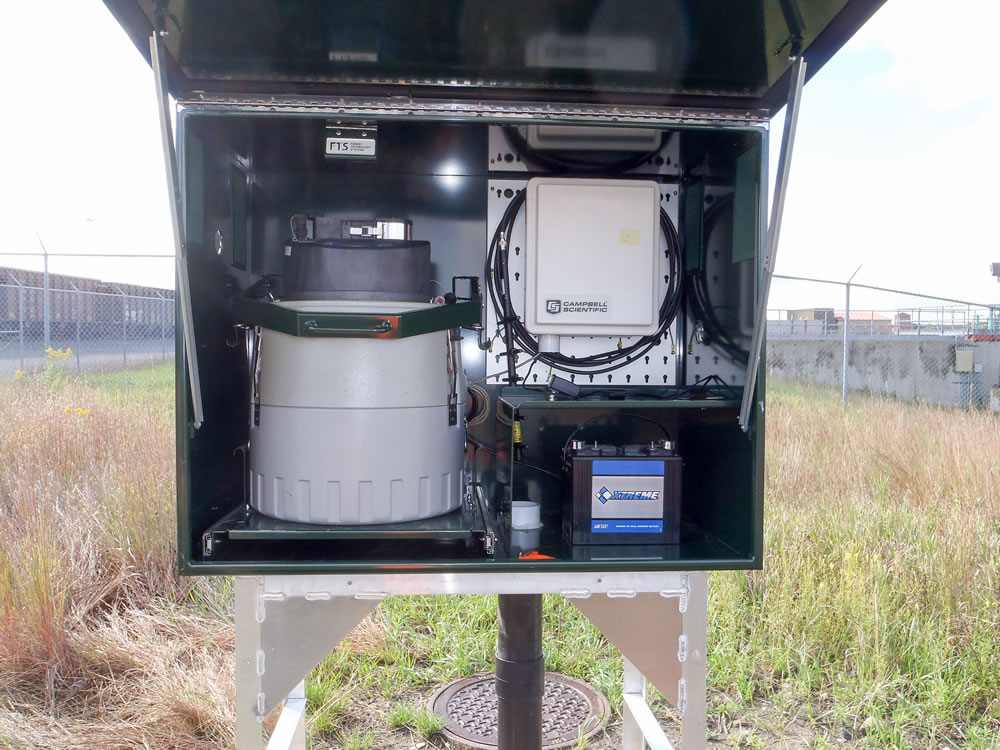
Five long-term stormwater monitoring sites are equipped with area/velocity sensors installed within the pipe as well as automated water quality samplers. The area/velocity sensor is connected to the automated sampler via a cable. The sensor measures water level and velocity in the pipe and these measurements are recorded every 5 minutes in the sampler where the level and velocity measurements, along with information about the pipe’s dimensions, are used to compute the discharge or flow rate of water through the pipe. A typical automated stormwater site setup is shown below.
In 2008, the MWMO, in collaboration with scientists at the University of Minnesota’s St. Anthony Falls Laboratory, designed and deployed a continuous automated water monitoring network at the long-term stormwater monitoring sites. The network was built to enable the remote display of the data in real time and allow for the control of the automated samplers from a remote location. The system uses a network of data-loggers and radios to collect and transmit data from stormwater sites to a web service that creates graphs and tables describing current and past conditions. With this network, automated samplers can be controlled from afar and their sampling programs changed based on site conditions and weather forecasts. Details about the specific hardware and software used in the network are included in the 2013 MWMO Annual Monitoring Report (PDF).
The MWMO has recently installed area/velocity sensors at various upstream locations within pipesheds. Most of these sites currently collect water quantity data only and are used to provide a more detailed look at runoff from smaller subwatersheds than the long-term monitoring sites mentioned above. These data have contributed to the development of stormwater models for pipesheds within the MWMO. Such models are used to predict areas of flooding and infrastructure requirements during a given storm event. The data are also useful in calibrating stormwater quality models which are used to inform best management practices and pinpoint locations within the watershed where projects can have the greatest impact on improving water quality.
Sample Collection, Handling, and Preservation
To collect stormwater quality data, grab and composite samples are collected from the five long-term stormwater sites in the MWMO watershed. For the majority of parameters, samples are collected in laboratory-cleansed (non-sterile) plastic bottles. Samples are either collected directly into the bottle as grab samples or with automated samplers as described below.
The automatic samplers house 24, 1-liter plastic bottles for sample collection. Samplers are programmed so that once the water level in the pipe reaches a certain value above baseflow, the sampler is enabled to start sampling. Once enabled, the sampler rinses the sample tubing before drawing the sample into the containers. Samples are collected on a flow-paced basis, meaning a bottle is filled each time a specified amount of water has flowed past the sensor. Once collected, the bottles are composited by a monitoring specialist by pouring an equal amount of water from each sampler bottle into a bottle for laboratory submittal.
Stormwater composite samples are collected for a minimum of three precipitation events per month, as long as that many events occur. If baseflow conditions are present, grab samples are collected twice per month, year-round.
Sampling Quality Control
Blank samples of deionized (DI) water are submitted to laboratories quarterly to verify that sample containers are clean and samples are not contaminated during travel. In addition, 10 percent of samples are collected in duplicate to verify that sampling and laboratory procedures do not jeopardize the data. Equipment blanks are also collected on a quarterly basis where DI water is pumped through the automated sampler tubing and submitted to ensure that equipment conditions are not affecting sample results.
Laboratory Analysis
Samples are analyzed at the Metropolitan Council Environmental Services (MCES) laboratory. The laboratory follows strict protocols for quality assurance and quality control. Information regarding laboratory protocol is available from MWMO staff. Refer to Table A.1 in Appendix A in the annual monitoring reports for a list of sample parameters, the laboratories used for analysis, the analysis methods, and information regarding certification.
Data Analysis
The following data cleaning techniques are used to ensure quality data:
- Suspect data are flagged and verified with the laboratory
- Statistical regression techniques are used to interpolate automated flow data that are missing due to equipment problems